|
|


Chapter 15 Examples
In this chapter we discuss the running and steering of WHIZARD with
the help of several examples. These examples can be found in the
share/examples directory of your installation. All of these
examples are also shown on the WHIZARD Wiki page:
https://whizard.hepforge.org/trac/wiki.
15.1 Z lineshape at LEP I
By this example, we demonstrate how a scan over collision energies
works, using as example the measurement of the Z lineshape at LEP I
in 1989. The SINDARIN script for this example, Z-lineshape.sin
can be found in the share/examples folder of the WHIZARD
installation. We first use the Standard model as physics model:
Aliases for electron, muon and their antiparticles as leptons and
those including the photon as particles in general are introduced:
alias lep = e1:E1:e2:E2
alias prt = lep:A
|
Next, the two processes are defined, e+e− → µ+µ−, and the same with an
explicit QED photon: e+e− → µ+µ−γ,
process bornproc = e1, E1 => e2, E2
process rc = e1, E1 => e2, E2, A
compile
|
and the processes are compiled. Now, we define some very loose cuts to
avoid singular regions in phase space, name an infrared cutoff of 100
MeV for all particles, a cut on the angular separation from the beam
axis and a di-particle invariant mass cut which regularizes collinear
singularities:
cuts = all E >= 100 MeV [prt]
   and all abs (cos(Theta)) <= 0.99 [prt]
   and all M2 >= (1 GeV)^2 [prt, prt]
|
For the graphical analysis, we give a description and labels for the
x- and y-axis in LATEX syntax:
$description = "A WHIZARD Example"
$x_label = "$\sqrt{s}$/GeV"
$y_label = "$\sigma(s)$/pb"
|
We define two plots for the lineshape of the e+e− → µ+µ− process between 88
and 95 GeV,
$title = "The Z Lineshape in $e^+e^-\to\mu^+\mu^-$"
plot lineshape_born { x_min = 88 GeV  x_max = 95 GeV }
|
and the same for the radiative process with an additional photon:
$title = "The Z Lineshape in $e^+e^-\to\mu^+\mu^-\gamma$"
plot lineshape_rc { x_min = 88 GeV  x_max = 95 GeV }
|
The next part of the SINDARIN file actually performs the scan:
scan sqrts = ((88.0 GeV => 90.0 GeV /+ 0.5 GeV),
              (90.1 GeV => 91.9 GeV /+ 0.1 GeV),
              (92.0 GeV => 95.0 GeV /+ 0.5 GeV)) {
  beams = e1, E1
  integrate (bornproc) { iterations = 2:1000:"gw", 1:2000 }
  record lineshape_born (sqrts, integral (bornproc) / 1000)
  integrate (rc)   { iterations = 5:3000:"gw", 2:5000 }
  record lineshape_rc (sqrts, integral (rc) / 1000)
}
|
So from 88 to 90 GeV, we go in 0.5 GeV steps, then from 90 to 92 GeV
in tenth of GeV, and then up to 95 GeV again in half a GeV steps. The
partonic beam definition is redundant. Then, the born process is
integrated, using a certain specification of calls with adaptation of
grids and weights, as well as a final pass. The lineshape of the Born
process is defined as a record statement, generating tuples of
√s and the Born cross section (converted from femtobarn to
picobarn). The same happens for the radiative 2→3 process with a
bit more iterations because of the complexity, and the definition of
the corresponding lineshape record. If you run the SINDARIN script, you will find an output like:
|
| | Process library 'default_lib': loading
| Process library 'default_lib': ... success.
$description = "A WHIZARD Example"
$x_label = "$\sqrt{s}$/GeV"
$y_label = "$\sigma(s)$/pb"
$title = "The Z Lineshape in $e^+e^-\to\mu^+\mu^-$"
x_min = 8.800000000000E+01
x_max = 9.500000000000E+01
$title = "The Z Lineshape in $e^+e^-\to\mu^+\mu^-\gamma$"
x_min = 8.800000000000E+01
x_max = 9.500000000000E+01
sqrts = 8.800000000000E+01
| RNG: Initializing TAO random-number generator
| RNG: Setting seed for random-number generator to 10713
| Initializing integration for process bornproc:
| ------------------------------------------------------------------------
| Process [scattering]: 'bornproc'
| Library name = 'default_lib'
| Process index = 1
| Process components:
| 1: 'bornproc_i1': e-, e+ => mu-, mu+ [omega]
| ------------------------------------------------------------------------
| Beam structure: e-, e+
| Beam data (collision):
| e- (mass = 5.1099700E-04 GeV)
| e+ (mass = 5.1099700E-04 GeV)
| sqrts = 8.800000000000E+01 GeV
| Phase space: generating configuration ...
| Phase space: ... success.
| Phase space: writing configuration file 'bornproc_i1.phs'
| Phase space: 1 channels, 2 dimensions
| Phase space: found 1 channel, collected in 1 grove.
| Phase space: Using 1 equivalence between channels.
| Phase space: wood
| Applying user-defined cuts.
| OpenMP: Using 8 threads
| Starting integration for process 'bornproc'
| Integrate: iterations = 2:1000:"gw", 1:2000
| Integrator: 1 chains, 1 channels, 2 dimensions
| Integrator: Using VAMP channel equivalences
| Integrator: 1000 initial calls, 20 bins, stratified = T
| Integrator: VAMP
|=============================================================================|
| It Calls Integral[fb] Error[fb] Err[%] Acc Eff[%] Chi2 N[It] |
|=============================================================================|
1 800 2.5881432E+05 1.85E+03 0.72 0.20* 48.97
2 800 2.6368495E+05 9.25E+02 0.35 0.10* 28.32
|-----------------------------------------------------------------------------|
2 1600 2.6271122E+05 8.28E+02 0.32 0.13 28.32 5.54 2
|-----------------------------------------------------------------------------|
3 1988 2.6313791E+05 5.38E+02 0.20 0.09* 35.09
|-----------------------------------------------------------------------------|
3 1988 2.6313791E+05 5.38E+02 0.20 0.09 35.09
|=============================================================================|
| Time estimate for generating 10000 events: 0d:00h:00m:05s
[.......]
|
| |
|
|
and then the integrations for the other energy points of the scan will


| Figure 15.1: Z lineshape in the dimuon final
state (left), and with an additional photon (right) |
follow, and finally the same is done for the radiative process as
well. At the end of the SINDARIN script we compile the graphical
WHIZARD analysis and direct the data for the plots into the file
Z-lineshape.dat:
compile_analysis { $out_file = "Z-lineshape.dat" }
|
In this case there is no event generation, but simply the cross
section values for the scan are dumped into a data file:
|
| $out_file = "Z-lineshape.dat"
| Opening file 'Z-lineshape.dat' for output
| Writing analysis data to file 'Z-lineshape.dat'
| Closing file 'Z-lineshape.dat' for output
| Compiling analysis results display in 'Z-lineshape.tex'
|
| |
|
|
Fig. 15.1 shows the graphical WHIZARD output of the
Z lineshape in the dimuon final state from the scan on the left, and
the same for the radiative process with an additional photon on the
right.
15.2 W pairs at LEP II
This example which can be found as file LEP_cc10.sin in the
share/examples directory, shows W pair production in the
semileptonic mode at LEP II with its final energy of 209 GeV. Because
there are ten contributing Feynman diagrams, the process has been
dubbed CC10: charged current process with 10 diagrams. We work within
the Standard Model:
Then the process is defined, where no flavor summation is done for the
jets here:
process cc10 = e1, E1 => e2, N2, u, D
|
A compilation statement is optional, and then we set the muon mass to
zero:
The final LEP center-of-momentum energy of 209 GeV is set:
Then, we integrate the process:
integrate (cc10) { iterations = 12:20000 }
|
Running the SINDARIN file up to here, results in the output:
|
| | Process library 'default_lib': loading
| Process library 'default_lib': ... success.
SM.mmu = 0.000000000000E+00
sqrts = 2.090000000000E+02
| RNG: Initializing TAO random-number generator
| RNG: Setting seed for random-number generator to 31255
| Initializing integration for process cc10:
| ------------------------------------------------------------------------
| Process [scattering]: 'cc10'
| Library name = 'default_lib'
| Process index = 1
| Process components:
| 1: 'cc10_i1': e-, e+ => mu-, numubar, u, dbar [omega]
| ------------------------------------------------------------------------
| Beam structure: [any particles]
| Beam data (collision):
| e- (mass = 5.1099700E-04 GeV)
| e+ (mass = 5.1099700E-04 GeV)
| sqrts = 2.090000000000E+02 GeV
| Phase space: generating configuration ...
| Phase space: ... success.
| Phase space: writing configuration file 'cc10_i1.phs'
| Phase space: 25 channels, 8 dimensions
| Phase space: found 25 channels, collected in 7 groves.
| Phase space: Using 25 equivalences between channels.
| Phase space: wood
Warning: No cuts have been defined.
| OpenMP: Using 8 threads
| Starting integration for process 'cc10'
| Integrate: iterations = 12:20000
| Integrator: 7 chains, 25 channels, 8 dimensions
| Integrator: Using VAMP channel equivalences
| Integrator: 20000 initial calls, 20 bins, stratified = T
| Integrator: VAMP
|=============================================================================|
| It Calls Integral[fb] Error[fb] Err[%] Acc Eff[%] Chi2 N[It] |
|=============================================================================|
1 19975 6.4714908E+02 2.17E+01 3.36 4.75* 2.33
2 19975 7.3251876E+02 2.45E+01 3.34 4.72* 2.17
3 19975 6.7746497E+02 2.39E+01 3.52 4.98 1.77
4 19975 7.2075198E+02 2.41E+01 3.34 4.72* 1.76
5 19975 6.5976152E+02 2.26E+01 3.43 4.84 1.46
6 19975 6.6633310E+02 2.26E+01 3.39 4.79* 1.43
7 19975 6.7539385E+02 2.29E+01 3.40 4.80 1.43
8 19975 6.6754027E+02 2.11E+01 3.15 4.46* 1.41
9 19975 7.3975817E+02 2.52E+01 3.40 4.81 1.53
10 19975 7.2284275E+02 2.39E+01 3.31 4.68* 1.47
11 19975 6.5476917E+02 2.18E+01 3.33 4.71 1.33
12 19975 7.2963866E+02 2.54E+01 3.48 4.92 1.46
|-----------------------------------------------------------------------------|
12 239700 6.8779583E+02 6.69E+00 0.97 4.76 1.46 2.18 12
|=============================================================================|
| Time estimate for generating 10000 events: 0d:00h:01m:16s
| Creating integration history display cc10-history.ps and cc10-history.pdf
|
| |
|
|
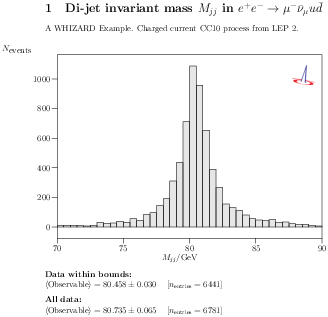
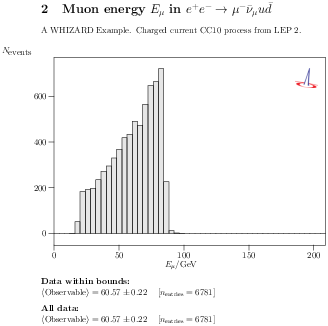
| Figure 15.2: Histogram of the dijet invariant mass from the CC10 W
pair production at LEP II, peaking around the W mass (upper
plot), and of the muon energy (lower plot). |
The next step is event generation. In order to get smooth
distributions, we set the integrated luminosity to 10
fb−1. (Note that LEP II in its final year 2000 had an
integrated luminosity of roughly 0.2 fb−1.)
With the simulated events corresponding to those 10 inverse femtobarn
we want to perform a WHIZARD analysis: we are going to plot the
dijet invariant mass, as well as the energy of the outgoing muon. For
the plot of the analysis, we define a description and label the y
axis:
$description =
  "A WHIZARD Example.
   Charged current CC10 process from LEP 2."
$y_label = "$N_{\textrm{events}}$"
|
We also use LATEX-syntax for the title of the first plot and the
x-label, and then define the histogram of the dijet invariant mass
in the range around the W mass from 70 to 90 GeV in steps of half a
GeV:
$title = "Di-jet invariant mass $M_{jj}$ in $e^+e^- \to \mu^- \bar\nu_\mu u \bar d$"
$x_label = "$M_{jj}$/GeV"
histogram m_jets (70 GeV, 90 GeV, 0.5 GeV)
|
And we do the same for the second histogram of the muon energy:
$title = "Muon energy $E_\mu$ in $e^+e^- \to \mu^- \bar\nu_\mu u \bar d$"
$x_label = "$E_\mu$/GeV"
histogram e_muon (0 GeV, 209 GeV, 4)
|
Now, we define the analysis consisting of two record
statements initializing the two observables that are plotted as
histograms:
analysis = record m_jets (eval M [u,D]);
           record e_muon (eval E [e2])
|
At the very end, we perform the event generation
and finally the writing and compilation of the analysis in a named
data file:
compile_analysis { $out_file = "cc10.dat" }
|
This event generation part screen output looks like this:
|
| luminosity = 1.000000000000E+01
$description = "A WHIZARD Example.
Charged current CC10 process from LEP 2."
$y_label = "$N_{\textrm{events}}$"
$title = "Di-jet invariant mass $M_{jj}$ in $e^+e^- \to \mu^- \bar\nu_\mu u \bar d$"
$x_label = "$M_{jj}$/GeV"
$title = "Muon energy $E_\mu$ in $e^+e^- \to \mu^- \bar\nu_\mu u \bar d$"
$x_label = "$E_\mu$/GeV"
| Starting simulation for process 'cc10'
| Simulate: using integration grids from file 'cc10_m1.vg'
| RNG: Initializing TAO random-number generator
| RNG: Setting seed for random-number generator to 9910
| OpenMP: Using 8 threads
| Simulation: using n_events as computed from luminosity value
| Events: writing to raw file 'cc10.evx'
| Events: generating 6830 unweighted, unpolarized events ...
| Events: event normalization mode '1'
| ... event sample complete.
Warning: Encountered events with excess weight: 39 events ( 0.571 %)
| Maximum excess weight = 1.027E+00
| Average excess weight = 6.764E-04
| Events: closing raw file 'cc10.evx'
$out_file = "cc10.dat"
| Opening file 'cc10.dat' for output
| Writing analysis data to file 'cc10.dat'
| Closing file 'cc10.dat' for output
| Compiling analysis results display in 'cc10.tex'
|
| |
|
|
Then comes the LATEX output of the compilation of the graphical
analysis. Fig. 15.2 shows the two histograms as the are
produced as result of the WHIZARD internal graphical analysis.
15.3 Higgs search at LEP II
This example can be found under the name LEP_higgs.sin in the
share/doc folder of WHIZARD. It displays different search
channels for a very light would-be SM Higgs boson of mass 115 GeV at
the LEP II machine at its highest energy it finally achieved, 209 GeV.
First, we use the Standard Model:
Then, we define aliases for neutrinos, antineutrinos, light quarks and
light anti-quarks:
alias n = n1:n2:n3
alias N = N1:N2:N3
alias q = u:d:s:c
alias Q = U:D:S:C
|
Now, we define the signal process, which is Higgsstrahlung,
process zh = e1, E1 => Z, h
|
the missing-energy channel,
process nnbb = e1, E1 => n, N, b, B
|
and finally the 4-jet as well as dilepton-dijet channels:
process qqbb = e1, E1 => q, Q, b, B
process bbbb = e1, E1 => b, B, b, B
process eebb = e1, E1 => e1, E1, b, B
process qqtt = e1, E1 => q, Q, e3, E3
process bbtt = e1, E1 => b, B, e3, E3

compile
|
and we compile the code. We set the center-of-momentum energy to the
highest energy LEP II achieved,
For the Higgs boson, we take the values of a would-be SM Higgs boson
with mass of 115 GeV, which would have had a width of a bit more than
3 MeV:
mH = 115 GeV
wH = 3.228 MeV
|
We take a running b quark mass to take into account NLO corrections
to the Hbb vertex, while all other fermions are massless:
mb = 2.9 GeV
me = 0
ms = 0
mc = 0
|
|
| | Process library 'default_lib': loading
| Process library 'default_lib': ... success.
sqrts = 2.090000000000E+02
SM.mH = 1.150000000000E+02
SM.wH = 3.228000000000E-03
SM.mb = 2.900000000000E+00
SM.me = 0.000000000000E+00
SM.ms = 0.000000000000E+00
SM.mc = 0.000000000000E+00
|
| |
|
|
To avoid soft-collinear singular phase-space regions, we apply an
invariant mass cut on light quark pairs:
cuts = all M >= 10 GeV [q,Q]
|
Now, we integrate the signal process as well as the combined signal
and background processes:
integrate (zh) { iterations = 5:5000}

integrate(nnbb,qqbb,bbbb,eebb,qqtt,bbtt) { iterations = 12:20000 }
|
|
| | RNG: Initializing TAO random-number generator
| RNG: Setting seed for random-number generator to 21791
| Initializing integration for process zh:
| ------------------------------------------------------------------------
| Process [scattering]: 'zh'
| Library name = 'default_lib'
| Process index = 1
| Process components:
| 1: 'zh_i1': e-, e+ => Z, H [omega]
| ------------------------------------------------------------------------
| Beam structure: [any particles]
| Beam data (collision):
| e- (mass = 0.0000000E+00 GeV)
| e+ (mass = 0.0000000E+00 GeV)
| sqrts = 2.090000000000E+02 GeV
| Phase space: generating configuration ...
| Phase space: ... success.
| Phase space: writing configuration file 'zh_i1.phs'
| Phase space: 1 channels, 2 dimensions
| Phase space: found 1 channel, collected in 1 grove.
| Phase space: Using 1 equivalence between channels.
| Phase space: wood
| Applying user-defined cuts.
| OpenMP: Using 8 threads
| Starting integration for process 'zh'
| Integrate: iterations = 5:5000
| Integrator: 1 chains, 1 channels, 2 dimensions
| Integrator: Using VAMP channel equivalences
| Integrator: 5000 initial calls, 20 bins, stratified = T
| Integrator: VAMP
|=============================================================================|
| It Calls Integral[fb] Error[fb] Err[%] Acc Eff[%] Chi2 N[It] |
|=============================================================================|
1 4608 1.6114109E+02 5.52E-04 0.00 0.00* 99.43
2 4608 1.6114220E+02 5.59E-04 0.00 0.00 99.43
3 4608 1.6114103E+02 5.77E-04 0.00 0.00 99.43
4 4608 1.6114111E+02 5.74E-04 0.00 0.00* 99.43
5 4608 1.6114103E+02 5.66E-04 0.00 0.00* 99.43
|-----------------------------------------------------------------------------|
5 23040 1.6114130E+02 2.53E-04 0.00 0.00 99.43 0.82 5
|=============================================================================|
[.....]
|
| |
|
|
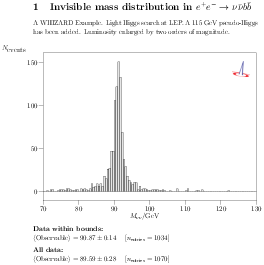
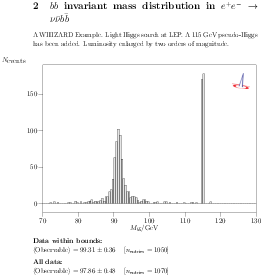
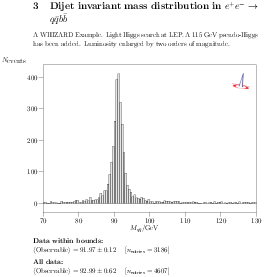
| Figure 15.3: Upper line: final state bb + Emiss, histogram of
the invisible mass distribution (left), and of the di-b
distribution (right). Lower plot: light dijet distribution in the
bbjj final state. |
Because the other integrations look rather similar, we refrain from
displaying them here, too. As a next step, we define titles,
descriptions and axis labels for the histograms we want to
generate. There are two of them, one os the invisible mass
distribution, the other is the di-b-jet invariant mass. Both
histograms are taking values between 70 and 130 GeV with
bin widths of half a GeV:
$description =
  "A WHIZARD Example. Light Higgs search at LEP. A 115 GeV pseudo-Higgs
    has been added. Luminosity enlarged by two orders of magnitude."
$y_label = "$N_{\textrm{events}}$"

$title = "Invisible mass distribution in $e^+e^- \to \nu\bar\nu b \bar b$"
$x_label = "$M_{\nu\nu}$/GeV"
histogram m_invisible (70 GeV, 130 GeV, 0.5 GeV)

$title = "$bb$ invariant mass distribution in $e^+e^- \to \nu\bar\nu b \bar b$"
$x_label = "$M_{b\bar b}$/GeV"
histogram m_bb (70 GeV, 130 GeV, 0.5 GeV)
|
The analysis is initialized by defining the two records for the
invisible mass and the invariant mass of the two b jets:
analysis = record m_invisible (eval M [n,N]);
           record m_bb (eval M [b,B])
|
In order to have enough statistics, we enlarge the LEP integrated
luminosity at 209 GeV by more than two orders of magnitude:
We start event generation by simulating the process with two b jets
and two neutrinos in the final state:
As a third histogram, we define the dijet invariant mass of two light
jets:
$title = "Dijet invariant mass distribution in $e^+e^- \to q \bar q b \bar b$"
$x_label = "$M_{q\bar q}$/GeV"
histogram m_jj (70 GeV, 130 GeV, 0.5 GeV)
|
Then we simulate the 4-jet process defining the light-dijet
distribution as a local record:
simulate (qqbb) { analysis = record m_jj (eval M / 1 GeV [combine [q,Q]]) }
|
Finally, we compile the analysis,
compile_analysis { $out_file = "lep_higgs.dat" }
|
|
| | Starting simulation for process 'nnbb'
| Simulate: using integration grids from file 'nnbb_m1.vg'
| RNG: Initializing TAO random-number generator
| RNG: Setting seed for random-number generator to 21798
| OpenMP: Using 8 threads
| Simulation: using n_events as computed from luminosity value
| Events: writing to raw file 'nnbb.evx'
| Events: generating 1070 unweighted, unpolarized events ...
| Events: event normalization mode '1'
| ... event sample complete.
Warning: Encountered events with excess weight: 207 events ( 19.346 %)
| Maximum excess weight = 1.534E+00
| Average excess weight = 4.909E-02
| Events: closing raw file 'nnbb.evx'
$title = "Dijet invariant mass distribution in $e^+e^- \to q \bar q b \bar b$"
$x_label = "$M_{q\bar q}$/GeV"
| Starting simulation for process 'qqbb'
| Simulate: using integration grids from file 'qqbb_m1.vg'
| RNG: Initializing TAO random-number generator
| RNG: Setting seed for random-number generator to 21799
| OpenMP: Using 8 threads
| Simulation: using n_events as computed from luminosity value
| Events: writing to raw file 'qqbb.evx'
| Events: generating 4607 unweighted, unpolarized events ...
| Events: event normalization mode '1'
| ... event sample complete.
Warning: Encountered events with excess weight: 112 events ( 2.431 %)
| Maximum excess weight = 8.875E-01
| Average excess weight = 4.030E-03
| Events: closing raw file 'qqbb.evx'
$out_file = "lep_higgs.dat"
| Opening file 'lep_higgs.dat' for output
| Writing analysis data to file 'lep_higgs.dat'
| Closing file 'lep_higgs.dat' for output
| Compiling analysis results display in 'lep_higgs.tex'
|
| |
|
|
The graphical analysis of the events generated by WHIZARD are shown
in Fig. 15.3. In the upper left, the invisible mass
distribution in the bb + Emiss state is shown, peaking
around the Z mass. The upper right shows the M(bb)
distribution in the same final state, while the lower plot has the
invariant mass distribution of the two non-b-tagged (light) jets in
the bbjj final state. The latter shows only the Z
peak, while the former exhibits the narrow would-be 115 GeV Higgs
state.
15.4 Deep Inelastic Scattering at HERA
15.5 W endpoint at LHC
15.6 SUSY Cascades at LHC
15.7 Polarized WW at ILC


|


